
World Wrestling Federation

TV Guide
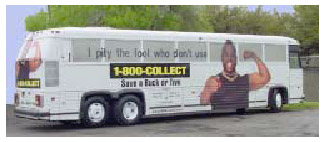
MCI 1-800- COLLECT
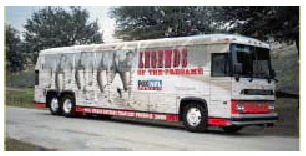
Fox NFL Pre-Game Show
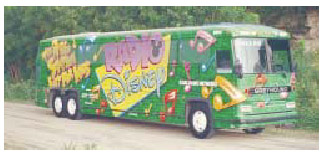
Radio Disney
Roadmark represents Greyhound for Theme Bus advertising. Greyhound circulation is regionalized. For more information, please inquire.
Greyhound Rolling Billboards
Samples
World Wrestling Federation |
TV Guide |
MCI 1-800- COLLECT |
Fox NFL Pre-Game Show |
Radio Disney |
|
Wrapping Options
 |
"Full Wrap" |
 |
Tail Only Approx. 90 sq. ft. |
 |
"Side Mural" Approx. 480 sq. ft. |
||
 |
"Super King" Approx. 250 sq. ft. |
 |
1/4 Tail Only Approx. 45 sq. ft. |
National Coverage
Motorcoaches travel an average of 130,000-200,000 annually. (Routes of five (5) randomly chosen motorcoaches). Click the image below for a more detailed map.

Audience Projections
(Source : The Richards Group)
Three (3) methods were
used to determine the number of impressions per bus during one year, based on
the research sources outlined here. The most conservative of the three (3),
Method 1, was selected as the average impressions benchmark (per bus/per year)
for this Program.
| Method 1 | ||
| Annual mileage/bus | 130,000 | |
| x 101 visual impressions / mile | x 101 | |
| Total | 13,130,000 | |
| Additional audience | ||
| + same direction traffic, frontage roads, rest stops, etc. +15% | 1,969,500 | |
| + impressions from front and back of bus +9% | 1,181,700 | |
| + pedestrians, urban, etc. +25% | 3,282,500 | |
| TOTAL | 19,563,000 | |
| Method 2 | ||
| Vehicles / hour | 2,320 | |
| x 12 hours / day | x12 | |
| 27,840 | ||
| x persons / vehicle | x 1.8 | |
| 50,112 | ||
| x days / year | x365 | |
| Total | 18,290,880 | |
| Additional audience | ||
| + pedestrians, urban, etc. +25% | 4,572,720 | |
| TOTAL | 22,863,600 | |
| Method 3 | ||
| Annual mileage / bus | 130,000 | |
| x 187.2 visual imp ressions / mile (101 + 4 .51% year) | x187.2 | |
| Total | 24,336,000 | |
| Additional audience | ||
| + same direction traffic, frontage roads, rest stops, etc. +15% | 3,650,400 | |
| + impressions from front and back of bus + 9% | 2,190,240 | |
| + pedestrians, urban, etc. +25% | 6 084,000 | |
| TOTAL | 36,260,640 |
Based on American
Trucking Assoc. research, 101 visual impressions per mile are cumed on interstate
(intrastate highways).
Based on DOT research, traffic has increased 4.51% per year since 1970 per study
conducted in 1989 (19 years in study).
On-Road Demographics (Viewers of Greyhound Buses)
Over 1 billion annual person trips by motor vehicle. (Trip = travel to somewhere 100 or more miles away and return. By car, truck, or RV)
Average number of people per travel party are 1.9. 69% of travel
parties are 2 or more people. Average round-trip distance is 620 miles.
| Age | Adults | Household Income | Household Composition | ||||
| <18 | 21% | 18-34 | 37% | < $20K | 11% | Adult(s) Only | 56% |
| 18-34 | 29% | 35-54 | 41% | $20-30K | 18% | Adults + Children | 44% |
| 35-54 | 32% | 55-64 | 11% | $30-40K | 15% | ||
| 55+ | 18% | 65+ | 11% | $40-50K | 14% | ||
| $50K+ | 42% | ||||||
Source: 1997 Travel Market Report - Travel Industry Association of American Federal Highway Administration, U.S. Department of Transportation
In-Terminal Demographics (Travelers on Greyhound Buses)
| Age | Gender | Household Income | Household Size | ||||
| 16 to 24 | 32% | Female | 56% | <$ 15K | 34%* | One to Two people | 46% |
| 25 to 34 | 21% | Male | 44% | $15K to $25K | 16% | Three people | 19% |
| 35 to 44 | 16% | $25K to $35K | 16% | Four or more | 35% | ||
| 45 to 54 | 13% | $35K to $50K | 14% | ||||
| 55 to 64 | 9% | $50K + | 20% | ||||
| 65+ | 9% | ||||||
Source: Monthly passenger survey with respondents weighted to mirror the composition of all passengers by distance traveled. Sampling and statistical error may be as much as +/-2 percentage points.
* Under reporting of income in this category: the extra unreported cash pushes a significant number of respondents into the other higher income categories
